The international comparison clearly highlights our Country’s significantly low ranking as against the OECD average or vis-à-vis some Countries which are more directly comparable in terms of socio-economic development level, size and geographic location. Italy’s ranking as against other Countries is a constantly negative one as regards several sub-groups of the sample, so confirming Italy’s ranking in other statistics or rankings:
a) PISA data confirm on a recurring basis a relatively low ranking of our Country as regards 15-year-old student skills surveys: such data related to the overall performance of the national school system are necessarily reflected in the outcomes of the adult skills survey.
b) Despite the quantitative developments achieved in the last three decades, our Country’s education and schooling level stands below the level achieved by other comparable Countries. Early school-leaving in upper secondary schools and particularly in universities, appears to be particularly high despite the “3+2” reform of the university system. Given the relevance of higher education processes with respect to the development of PIAAC survey skills, such structural deficits obviously have a decisive impact.c) Data relating to labour market participation and employment rates in our Country confirm a downward trend compared to the average European trend with respect to:
- Female labour market participation;
- Labour market participation for workers aged 55 and above;
- Young workers’ unemployment rate.
Given the importance of work experience (clearly resulting also from the survey outcomes) in the development of skills assessed by the PIAAC survey, such structural weaknesses affecting the labour market obviously impact our Country’s overall performance.
d) The poor “quantity” of labour (see above data) is matched by an equally poor “quality” of available jobs, turning out to be particularly low, though unevenly spread over different areas of the Country. Low-skilled jobs and a low-innovation business system result in lower incentives for the population to acquire and maintain skills.
Italy’s results in the Survey of Adult Skills
The PIAAC survey results highlight Italy’s gap compared to other participant Countries:
– in literacy skills the average score for Italian adults between 16 and 65 years of age is equal to 250, a significantly lower score compared to the OECD average for PIAAC Survey participant Countries, which is equal to 273;
– in numeracy skills the average score for Italian adults between 16 and 65 years of age is equal to 247, a significantly lower score compared to the OECD average for PIAAC Survey participant Countries, which is equal to 269.
| Literacy Average | S.E. | Numeracy Average | S.E. | |
| Italy | 250 | 1,1 | 247 | 1,1 |
| OCSE-PIAAC Average | 273 | 0,2 | 269 | 0,2 |
Countries ranking significantly above the OECD average are Japan, Finland, Netherlands, Australia, Sweden, Norway, Estonia and Belgium, whose respective populations rank at level 3; on the other hand, Countries ranking significantly below the OECD average are Denmark, Germany, United States, Austria, Cyprus, Poland, Ireland, France, Spain and Italy, whose respective populations rank at level 2. All other Countries (Czech Republic, Slovak Republic, Canada, Korea, and United Kingdom) do not show statistically significant differences as against the OECD average.
Average literacy score for PIAAC Survey participant Countries
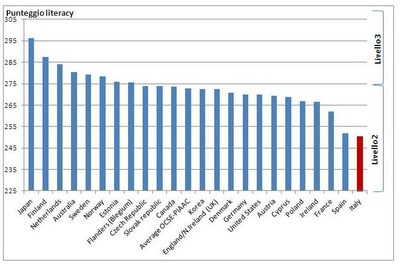
Skills analysed by the PIAAC survey are displayed as scores (on a 0-500 score scale) related to 6 different skill levels: achievement of level 3 is considered as the lowest level required for a positive integration with respect to social, economic and employment trends. Adult Italians (aged 16-65) rank in most cases at Level 2 both in the literacy domain (42.3%) and in the numeracy domain (39.0%), Level 3 or above is achieved by 29.8% of the population in literacy and by 28.9% in numeracy, while the lowest performance levels (Level 1 or below) are achieved by 27.9% of the population in literacy and by 31.9% in numeracy.
Level 5
Few adults are able to achieve this level in participating Countries: 0.7% within the OECD average. The Country with the highest percentage of adults ranking at Level 5 is Finland with 2.2% of the population, followed by Australia and the Netherlands (1.3%), Sweden and Japan (1.2%).
Level 4
An average 11.3% of participating Countries reach this level. Japan (21.6%) and Finland (20.0%) display the highest percentage of adults at this level. Italy (3.3%) and Spain (4.7%) are the Countries with the lowest percentage of adults ranking at Level 4.
Level 3
An average 38.7% of participating Countries attain this level, which is considered by OECD as the level allowing to live and work effectively in the XXIst century. This level is mostly achieved by Japan (49.2%), Slovakia (44.5%) and Norway (42.6%). Italy has the lowest percentage of adults at level 3 (26.5%) followed by Spain (28.0%).
Level 2
An average 33.7% of OECD-PIAAC Countries reach this level. Countries with the highest percentage of adults at level 2 are Italy (42.3%) and Spain (39.4%), followed by Austria (37.9%), Ireland (37.8%) and Czech Republic (37.7%).
Level 1
12.3% of adult participants in the OECD-PIAAC survey reach this level. Compared to other Countries, Italy (22.3%), Spain (20.4%) and France (16.4%) have the highest percentage of adults at this skill level; the best results are always achieved by Japan and Finland with the lowest percentage: respectively 4.4% and 7.9%
Below Level 1
In OECD-PIAAC Countries 3.4% of the population reach this skill level. Spain has the highest percentage of adults below level 1 (7.3%) followed by Italy (5.6%) and France (5.4%). Japan has only 0.6% of the population at this level, followed by the Czech Republic with 1.5%.
Overview and data processing by Simona Mineo.