Workers’ skills in terms of literacy and numeracy, as well as skills required and applied in workplaces, were analysed based on the two methodologies used in the PIAAC survey (cognitive tests and background questionnaire). The skill mismatch issue was also explored by the same approach.
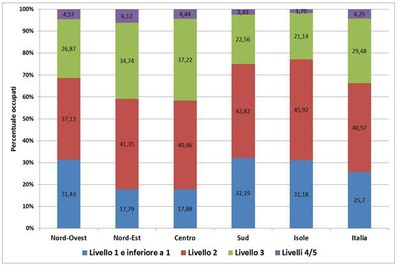
According to test results two thirds of employed respondents did not reach level 3 in literacy (66.3%). The situation appears to be different per territorial macro-areas: North-East and Centre regions have the lowest percentages of workers under skill level 3 (respectively 59.1% e 58.3%) and workers ranking at level 1 (approximately 18%).
Percentage of Employed respondents per literacy level and geographic area
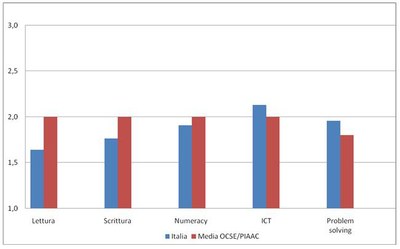
Italy achieved lower scores compared to the OCSE-PIAAC average as regards reading, writing and calculation applied skills, as well as discretion skills, workplace-learning skills and influencing skills. On the other hand, Italy’s score was above the OCSE-PIAAC average as regards the frequency of use of ICT and problem-solving skills at the workplace, with one of the highest averages of all participant Countries. This picture seems to highlight the prevalence of production environments mainly focused on skills traditionally more related to a manufacturing/traditional organisation of labour.
Average use of skills at work
Average use of skills at work
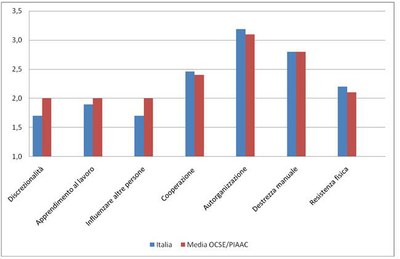
Note: scores close to 0 imply a low frequency of use of a given skill while scores close to 4 imply a high frequency.
As regards the qualification mismatch, in Italy 13% of workers are over-qualified[1] (as against a 21% OCSE-PIAAC average), while 22% of workers are under-qualified[2] : indeed, Italy has the highest average of under-qualified workers among PIAAC participating countries. The OCSE-PIAAC average of under-qualified workers is 13%.
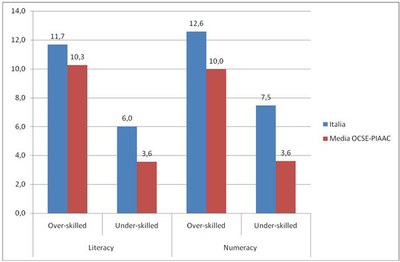
Skill mismatch percentages are as follows (see chart below): with regard to literacy the Italian average of over-skilled workers is 11.7%, as against an OCSE-PIAAC average equal to 10.3%, while the under-skilled average is 6% as against an OCSE-PIAAC average equal to 3.6%. The situation doesn’t change much with regard to numeracy: over-skilled are 12.6% as against 10% OCSE-PIAAC average, while under-skilled are 7.5% as against an OCSE-PIAAC average equal to 3.6%.
Over-skilled and under-skilled: Italy and OCSE-PIAAC average
[1] “Overqualification”: a condition where an individual’s level of education (in terms of qualifications) exceeds the level required by their job.
[2] “Under-qualification”: a condition where an individual’s level of education (in terms of qualifications) is below the level required by their job.
Overview and data processing by Michela Bastianelli and Fabio Roma