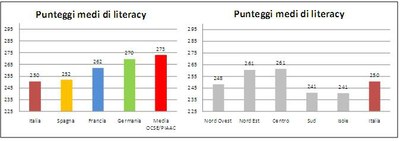
Respondents’ geographic location plays a crucial role in the distribution of skills within the Italian sample. In Northern regions, especially in the North-East area, as well as in Central regions, proficiency levels are fairly regularly higher than the Italian average, also higher than those recorded in Southern regions and Islands. The following chart displays the average literacy scores obtained in Italy as a whole as well as in the 5 macro-regions, and those obtained by the OECD average and in some Countries participating in the survey.
Average literacy scores obtained in 5 macro-regions compared to the OECD average and scores in Spain, France and Germany.
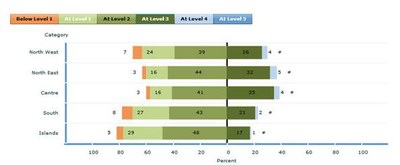
North-East and Centre regions appear on a par with many OECD Countries (respectively with 39% and 37% of the population ranking at level 3 or higher with regard to literacy). South and Islands regions obtained the worst performance: only 23% and 18% reached level 3 or higher in literacy, with a by and large quite similar spreading as regards numeracy.
Literacy levels per Italian macro-regions
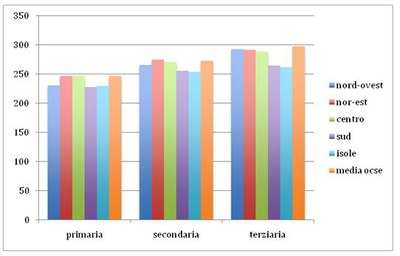
To confirm the substantial impact of different areas on results, it’s worth noting how fairly regular outcomes appear to be when crossing the level of education with areas of residence. For example, according to literacy data related to low-educated participants (primary education) and disaggregated per territorial area, residents in the Centre and North-East regions achieved a literacy score equal to 246, similar to the OECD average score and near the national average. On the other hand, those with a primary education level living in North-West, South and Islands Regions achieved considerably lower literacy scores, around 227-229 points. Similarly, among holders of a secondary school certificate, the best literacy skills were achieved in North East (274) and Central (269) regions. For secondary as well as for primary education, the lowest literacy skills were reported in South (254) and Islands (253) regions.
Average literacy scores per school certificate and territorial area, Italy vs OECD average
The following chart highlights a gap between Centre and North-East adults and those from other macroregions, regardless of the employment status. A further insight especially focused on the group of “Employed” highlights good performances as regards North-East and Centre workers, reporting literacy scores around 264 points (higher than the average of Employed Italians, which is equal to 254), vs 245 points for South and Islands workers.
Comparison among Italian macroregion average scores at 5th, 25th, 75th and 95th percentile on the literacy skill scale per employment status
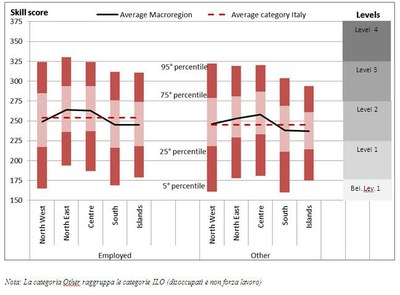
Note: the category “Other” includes ILO categories (Unemployed but not Workforce)
Overview and data processing by Simona Mineo and Giovanna Di Castro